
Inhaltsverzeichnis
Business Dashboard
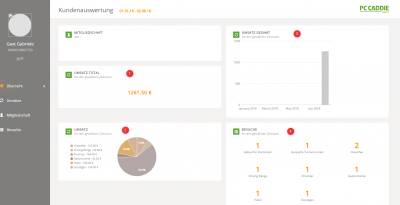
in this meaningful customer dashboard PC CADDIE shows the collected golf-relevant core information in a clear design for all customers starting with 2019.
Each PC CADDIE customer will be able to personalize and pre-define the Business Dashboard for their golf course.
Like a customer report page, the Business Dashboard displays all key figures and differentiates them according to point of sale (profit centers), sales and visitor numbers, and membership data.
All business figures can be automated from 2019, and easily viewed in context. Further reports on performance evaluation according to profit centers, in comparison periods, can be compiled and provided with the PC CADDIE Management Report Software Tool.
Prices: the Business Dashboard will be an integral part of PC CADDIE Customer Management Business starting with 2019, and will be available to customers free of charge.
Important: An initial setup report and PC CADDIE fee management are required for display. Please contact the support at support@pccaddie.com.
Prerequisites
The corresponding configuration should be made in the management report, to ensure a reasonable distribution of sales in the corresponding profit centers. The menu item can be found under Persons - Management Report. The explanations can be found here: Management report .
Customer Dashboard for members or guests
In the customer mask, click on the button „Report“ on the right-hand side. This will open the dashboard.

Visits
Find different charts of how many times a guest stays on your golf course for a certain period of time under Visits. The period considered in our example is 01.01.18 - 02.08.18. The time period is not freely selectable; PC CADDIE always calculates automatically from 01.01. of the respective year to the printing date.

- Total number of visits.
- The last activities depending on whether it is a timetable booking (TT) or a tournament booking (TURN) or a sales booking (SALE).
- The number of visits depending on the start time, tournament rounds, green fee, driving range, pro shop, catering, hotel or other.
- The played tournament rounds in the selected period.
Membershift
You can view these membership data via the menu window Membership:

- Current membership
- Membership history
Sales
Under Sales, the Customer Dashboard shows you the following:

All sales figures are gross amounts.
- Sales in percent depending on profit center green fee, driving range, pro shop, catering, hotel and miscellaneous.
- Sales broken down by account area, merchandise category, article description and amount.
- Sales chart by months.
Overview
The overview presents the following:

- Total sum of sales in the selected period.
- Total sales divided into the profit centers green fee, driving range, pro shop, catering, hotel and miscellaneous.
- Total sales divided by months.
- The number of visits per tee time, tournament rounds, green fee, driving range, pro shop, catering, hotel or other.
Customer Dashboard for a member
Our example is Martha Member:
The additional option Membership is available for members.
1. The current membership.
2. The evolution of the membership status.
- Keine Schlagworte vergeben
PC CADDIE AG
Bachtelweg 3
6048 Horw/Luzern
Schweiz
Kontakt
![]() Fon +49 2642 9854110
Fon +49 2642 9854110
Fax +49 2642 9854199
![]() Fon +41 41 5110600
Fon +41 41 5110600
Fax +41 41 5110699
![]() Fon +43 13 55667788
Fon +43 13 55667788
Fax +43 13 55667799
Mail support@pccaddie.com
Web www.pccaddie.com
Support Online-Module
PC CADDIE://online
GmbH & Co. KG
Fon: +49 2642 9854120
Fax: +49 2642 9854169
Mail support@pccaddie-online.de
Web www.pccaddie-online.de
Tägliche Supportzeiten:
April-Oktober
09.00 - 20.00 Uhr
November-März
09.00 - 18.00 Uhr